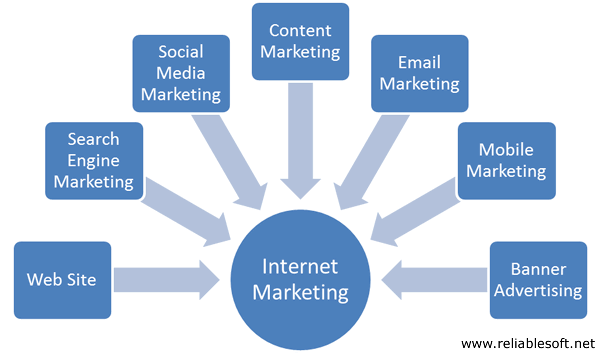
การทำการตลาดแบบ Digital Marketing มีหลายช่องทาง
– Mobile Marketing
– Content Marketing
– SocialMedia Marketing
– Infographic
Digital Marketing สามารถวัดผลได้จากจำนวนผู้ที่คลิกเข้ามาชมเว็บไซต์ หรือผู้ที่เข้ามาลงทะเบียนร่วมกิจกรรม แต่การจะได้ข้อมูลเหล่านี้ นักการตลาดต้องวางแผนไว้ตั้งแต่ต้น เพื่อให้ฝ่ายเทคนิคตระเตรียมระบบเก็บข้อมูลนี้ไว้ตั้งแต่สร้างสื่อดิจิตัล และต้องเลือกเก็บข้อมูลที่เป็นประโยชน์เพื่อนำมาต่อยอดได้จริงเท่านั้น
ในการทำ Digital Marketing จะมีเครื่องมือที่ใช้วิเคราะห์ผลนั่นก็คือ Digital Marketing Analytics โดยมีหลักพื้นฐานในการวัดค่าต่างๆ 3 ประการ
1. พฤติกรรม
การที่คุณทำการตลาดใดๆ ไปนั้น คุณล้วนมีเป้าหมายที่จะให้ผู้ที่ได้รับสาร หรือผู้ที่ได้รับประสบการณ์ เกิดการเปลี่ยนแปลง หรือ เกิดพฤติกรรมอะไรบางอย่างขึ้นมา ไม่ว่าจะเป็นการเห็นหรือกระทำอะไรบางอย่าง ซึ่งจะว่าไปแล้ว นี่คือสิ่งสำคัญที่สุดที่คุณอยากจะรู้เลยก็ว่าได้
2. ปริมาณของการเปลี่ยนแปลง
หลังจากที่คุณทราบแล้วว่า คุณต้องการอยากสร้าง / เปลี่ยนแปลงพฤติกรรมอะไรของกลุ่มเป้าหมาย สิ่งที่ตามมา คือ การดูว่าปริมาณของการเปลี่ยนแปลงดังกล่าวนั้นมีมากเท่าใด ซึ่งปริมาณดังกล่าวนั้นอาจจะมาในรูปปริมาณทั้งหมด หรือจะเป็นแบบค่าเฉลี่ยก็ได้
3. ระยะเวลา
การวิเคราะห์ข้อมูลต่างๆ นั้น ก็จำเป็นที่คุณจะต้องรู้ระยะเวลาของช่วงข้อมูลที่ต้องการจะวิเคราะห์ด้วย เพื่อให้สามารถกำหนดขอบเขตของการวัด / วิเคราะห์ได้อย่างถูกต้อง
Digital Marketing ในความจริงก็คือหลักการของ Marketing ที่เอามาปรับใช้ผ่านเครื่องมือ Digital และเน้นการสื่อสารด้วยวิธีคิดแบบ Digital ผ่านเครื่องมือ Digital หรือ Technology เป็นหลัก ซึ่งหลักการของ Marketing นั้นถ้าเอาตามตำราในอดีตเลยก็จะประกอบด้วยสิ่งที่เรียกกันว่า 4P คือ Product, Price, Place, Promotion ซึ่งแปลง่าย ๆ เองก็ประกอบด้วยผลิตภัณฑ์หรือบริการที่จะทำการตลาด, ราคาสินค้าหรือบริการที่จะทำการตลาด, วิธีการที่จะนำสินค้าไปสู่กลุ่มเป้าหมาย หรือตลาดของตัวเอง และสุดท้ายคือการทำกิจกรรมทางการตลาด
ถึงเวลาแบรนด์ไทยใช้กลยุทธ์ Digital Marketing
เมื่อสื่อดิจิตอลเข้ามามีบทบาทและมีความสำคัญต่อชีวิตประจำวันของคนรุ่นใหม่มากขึ้น จะเห็นได้จากกิจกรรมต่างๆ ตั้งแต่ตื่นนอนจนกระทั่งถึงเวลาเข้านอน ผู้บริโภคพึ่งพาสื่อดังกล่าวจนเป็นส่วนหนึ่งของชีวิต ทั้งเรื่องการสื่อสารและตอบสนองพฤติกรรมการบริโภค ทำให้สินค้าและบริการต่างๆ หันมาใช้สื่อดิจิตอลในการสร้างแบรนด์และสร้างการรับรู้ให้กับผู้บริโภค เพราะเป็นสื่อที่ทุกคนเข้าถึงได้โดยไม่ผ่านกระบวนการที่ซับซ้อน และมีศักยภาพในการกระตุ้นให้เกิดความสนใจ ช่วยให้เกิดการตัดสินใจซื้อ สิ่งที่กำลังจะเกิดในอนาคต คือ กลยุทธ์ Digital Marketing มีแนวโน้มการแข่งขันค่อนข้างสูง ผู้ประกอบการทั้งรายใหญ่และเอสเอ็มอีจะหันมาใช้ประโยชน์จากสื่อดิจิตอลเพิ่มมากขึ้น
ดังนั้น ธุรกิจที่ต้องการใช้ประโยชน์จากสื่อดังกล่าวต้องให้ความสำคัญกับการพัฒนารูปแบบการให้บริการและเทคโนโลยีที่สามารถตอบสนองไลฟ์สไตล์ของลูกค้า โทรศัพท์สมาร์ทโฟนได้กลายเป็นสิ่งสำคัญต่อวิถีชีวิตของคนเมือง หรือแม้กระทั่งคนในต่างจังหวัดไปแล้ว การใช้กลยุทธ์ Digital Marketing จึงต้องเลือกใช้สื่อที่เหมาะกับการสร้างแบรนด์รวมทั้งการขายสินค้าและบริการต่างๆ ปัจจุบันสื่อมีอิทธิพลต่อชีวิตประจำวันของผู้บริโภค เช่น ไลน์ เฟสบุ๊ค อินสตาแกรม ทวิตเตอร์ โดยเฉพาะไลน์พบว่าคนไทยใช้กว่า 30 ล้านคน หาก แบรนด์ใดสามารถพัฒนาแอพพลิเคชั่นโดนใจกลุ่มเป้าหมาย จะมีโอกาสเข้าถึงความรู้สึกที่แท้จริงของลูกค้า นอกจากนี้ Social Media ยังเป็นเครื่องมือทางการตลาดที่มีส่วนช่วยสนับสนุนเกิดการสร้างมูลค่าให้สินค้าและบริการ
โดยเฉพาะการนำเสนอข้อมูลต่างๆ สามารถสร้างความประทับใจให้กับลูกค้า ความสะดวก รวดเร็วของสื่อดิจิตอลทำให้สามารถแก้ไขปัญหาที่เกิดขึ้นกับลูกค้าได้รวดเร็ว นอกจากนี้ยังเป็นเครื่องมือที่สามารถสร้างฐานลูกค้าใหม่ แม้ว่ากลุ่มคนที่ติดตามกิจกรรมของแบรนด์ผ่านสื่อดิจิตอลยังไม่ซื้อหรือเป็นลูกค้า แต่ในอนาคตคนกลุ่มนี้ คือเป้าหมายสำคัญการสร้างยอดขาย นักการตลาดจะต้องสร้างความบันเทิงและกิจกรรมที่น่าติดตามอย่างต่อเนื่อง ไม่ว่าจะเป็นการแจกของรางวัล กิจกรรมชิงโชค รวมทั้งการสร้างสรรค์สิ่งใหม่ ๆ ตลอดเวลา ที่สำคัญควรมีโปรโมชั่นพิเศษเป็นตัวดึงดูดให้กลุ่มเป้าหมายเข้ามาพูดคุยกับแบรนด์ ทำให้เกิดความสัมพันธ์ที่ดี เมื่อมีการสื่อสารในลักษณะต่างๆ เกิดขึ้นระหว่างแบรนด์กับผู้บริโภค นักการตลาดสามารถเก็บข้อมูล ศึกษาพฤติกรรมผู้บริโภคได้ง่ายขึ้น รู้ว่าลูกค้าชอบหรือไม่ชอบอะไร หรือต้องการซื้อสินค้าและบริการแบบไหนฯลฯ
อย่างไรก็ตาม ที่ผ่านมาแบรนด์ต่างๆ ได้ใช้กลยุทธ์การตลาดในรูปแบบสติ๊กเกอร์ดึงดูดลูกค้าเข้ามามีส่วนร่วมกับแบรนด์ และผู้ที่กำลังจะเริ่มต้นทำสติกเกอร์เพื่อบุกตลาดจะต้องเน้นเรื่องการดีไซน์ให้สวยงาม สะดุดตา มีความหมายโดนใจนำมาใช้แสดงอารมณ์และความรู้สึกต่างๆ การเปิดโอกาสให้ลูกค้าเข้ามาดาวน์โหลดได้ฟรีทำให้เกิดการติดตาม เกิดการสื่อสารระหว่างแบรนด์กับลูกค้า ผู้ประกอบการที่ใช้กลยุทธ์ Digital Marketing ต้องทราบว่าสื่อ Social Media เป็นดาบ 2 คม เมื่อใช้ประโยชน์จากสื่อในเชิงบวกได้ ในขณะเดียวกันอาจมีผลสะท้อนกลับในเชิงลบได้เช่นกัน เนื่องจากเป็นสื่อที่ผู้คนจำนวนมากเข้าถึงได้อย่างเสรี หากมีการร้องเรียนจะทำให้กลุ่มคนจำนวนมากคิดว่าแบรนด์มีจุดอ่อน
โดยเฉพาะ Facebook ที่ผู้ประกอบการส่วนใหญ่เห็นตรงกันว่าเป็นช่องทางที่ลูกค้าใช้ร้องเรียนสูงถึง 90% ดังนั้น ทุกขั้นตอนการผลิตจะต้องเน้นเรื่องคุณภาพ เพื่อป้องกันมิให้เกิดการร้องเรียน หากเกิดปัญหากับลูกค้า ผู้ประกอบการจะต้องแก้ไขและตอบคำถาม ให้ลูกค้าเข้าใจภายในเวลารวดเร็ว เพื่อให้ลูกค้าเกิดความพึงพอใจ และผู้บริโภคคนอื่น ๆ เห็นถึงความใส่ใจในการแก้ไขปัญหาที่เกิดขึ้นกับลูกค้า นับเป็นส่วนหนึ่งของการบริการหลังการขาย ต้องไม่ลืมว่าหากทำให้ลูกค้าคนเดียวไม่พอใจจะทำให้ลูกค้าจำนวนมากรับรู้ในเรื่อง นั้นๆด้วย
นอกจากนี้การใช้กลยุทธ์ Digital Marketing เป็นการเพิ่มความสะดวก รวดเร็วให้กับลูกค้า ไม่ว่าจะใช้สื่อทำกิจกรรมใด ต้องสอดคล้องกับช่องทางเดิม ๆ ที่ลูกค้าเคยทำ แล้วสื่อสารให้ทราบว่าช่องทางใหม่นั้นสะดวกสบายกว่าเดิม เช่น ก่อนหน้านี้ประชาชนต้องเดินทางไปฝากและถอนเงินที่ธนาคาร การพัฒนานวัตกรรมความสะดวกสบายต่าง ๆ ของธนาคารจึงต้องเน้นเรื่องความสะดวกสบายในการฝากถอนและโอนเงิน โดยไม่ต้องไปถึงธนาคาร ดังนั้น “แอพพลิเคชั่น” มีความจำเป็นกับการตลาดยุคดิจิตอล ต้องตอบสนองพฤติกรรมการทำธุรกรรมของลูกค้า ไม่ว่าจะเป็นการซื้อ-ขายสินค้าและบริการ หรือแม้แต่ธุรกิจกรรมการเงิน ควรสื่อสารให้ลูกค้ารับรู้ถึงความปลอดภัย มิเช่นนั้นจะทำให้ขาดความน่าเชื่อถือและไม่ไว้วางใจที่จะใช้บริการ ไม่เฉพาะการทำธุรกรรมทางการเงินเท่านั้น แต่ธุรกิจอื่นๆ ที่ต้องการขายสินค้าหรือการสร้างแบรนด์ผ่าน Social Media รวมทั้งการเพิ่มความสะดวกสบายบนโทรศัพท์มือถือสมาร์ทโฟน จะต้องให้ลูกค้ากลุ่มเป้าหมายเข้าถึงความง่าย สะดวกสบาย ทันสมัย และปลอดภัย
นอกจากนี้ ผู้ประกอบการและนักการตลาดควรมีความพร้อม เรื่องการพัฒนาระบบและเทคโนโลยี บุคลากรที่มีศักยภาพในการทำงานให้ทันต่อความต้องการของลูกค้า ยุคดิจิตอลทุกอย่างมีความรวดเร็ว ลูกค้าจาก Social Media มีหลากหลายกลุ่ม จึงมีโอกาสเกิดปัญหาได้ง่ายกว่าการทำงานกับลูกค้าเฉพาะกลุ่ม แบรนด์ใดสามารถครองใจลูกค้าได้อย่างยาวนาน ผ่านกิจกรรมสร้างความสัมพันธ์อย่างต่อเนื่อง คนเหล่านี้จะเป็นสาวกของแบรนด์ในระยะยาว แต่สิ่งหนึ่งที่นักการตลาดต้องเข้าใจตรงกัน ลูกค้ามักจะเบื่อในสิ่งที่จำเจ ตัดสินใจซื้อง่ายขึ้น และมีโอกาสรับรู้สิ่งใหม่ ๆ จากคู่แข่ง การเข้าใจพฤติกรรมลูกค้าจะตอบโจทย์การ ทำงานสื่อ Social Media ทำให้นักการตลาดเรียนรู้ผู้บริโภคได้ไม่ยาก โดยเฉพาะเรียนรู้ว่าลูกค้าชอบอะไร ซึ่งมีความสำคัญกับกลยุทธ์ Digital Marketing เชื่อว่าในเร็วๆ นี้แบรนด์ส่วนใหญ่ทั้งของคนไทยและเพื่อนบ้าน จะหันมาใช้กลยุทธ์ Digital Marketing อย่างแพร่หลายมากขึ้น ผู้ประกอบการและนักการตลาดจะต้องใช้กลยุทธ์ในการทำงานที่มีประสิทธิภาพมากขึ้น ศึกษาการใช้สื่อโฆษณาดิจิตอล พิจารณาถึงผลลัพธ์ทางธุรกิจที่เกิดขึ้นจริง การกดไลค์ของลูกค้าอาจไม่ได้สร้างยอดขาย
ดังนั้นเมื่อมีการกดไลค์จะเปลี่ยนจากสถิติดังกล่าวมาเป็นยอดขายได้อย่างไร ต้องมีการประเมินประสิทธิภาพของสื่อแต่ละประเภท เช่น หากเฟสบุ๊คและไลน์ไม่สร้างยอดขาย แต่การส่ง SMS มียอดสั่งซื้อเข้ามามากกว่า ผู้ประกอบการต้องประเมินผล
เลือกสื่อที่ตรงกับความต้องการของลูกค้า สื่อ Social Media มีอิทธิพลแตกต่างกัน บางสื่อมีบทบาททำให้ลูกค้ารู้จัก ทำให้ทราบว่าลูกค้าต้องการอะไร บางสื่อสร้างกระแสให้กับตลาด บางสื่อสร้างยอดขาย ผู้ประกอบการควรทำการตลาดให้ชัดเจนว่าต้องการอะไรจากสื่อดังกล่าว
Digital Marketing กลายเป็นเทรนด์ที่ถูกพูดถึงเยอะมากในปัจจุบัน หลายๆ บริษัทมีการทุ่มเงินเข้ามามากขึ้น แต่น่าแปลกใจไม่น้อยที่เอาเข้าจริงๆ หลายคนก็ยังคิดว่า Digital Marketing คือการทำ Facebook หรือซื้อโฆษณาในเว็บต่างๆ
เรื่องน่าตลกอย่างหนึ่งคือ Digital Marketing กำลังเป็นเทรนด์แต่นักการตลาดหลายคน (หรือแม้แต่บางคนที่บอกตัวเองว่าเป็นนักการตลาดดิจิตอล) ก็ยังอธิบาย Digital Marketing แบบผิดๆ อยู่ไม่น้อย Social Media Today และ Agency Platform ได้ทำ Infographic อธิบายพื้นฐานเข้าใจง่ายของ Digital Marketing ว่าคืออะไรบ้าง ซึ่งก็น่าจะเหมาะกับคนที่สนใจและอยากเห็นภาพกว้างว่ามันมีอะไรมากกว่า Facebook หรือไม่
การทำ Digital Marketing ให้สำเร็จได้ ประกอบด้วยหลาย ๆ ส่วน
ไม่ใช่แค่การทำ Facebook Page, Facebook Ads, Line, Adwords, Content
ยิ่งบอกว่าสร้างแบรนด์บนโลก Digital นั้นยิ่งต้องหันกลับมาคิดว่าหลักการ Branding นั้นคืออะไร
และสิ่งที่ทำนั้นคือ Branding หรือไม่ ในยุคที่ Guru, Coach, Mentor กำลังเฟืองฟู
Digital Marketing ในความจริงก็คือหลักการของ Marketing ที่เอามาปรับใช้ผ่านเครื่องมือ Digital
และเน้นการสื่อสารด้วยวิธีคิดแบบ Digital
แสดงผลผ่านอุปกรณ์ Digital หรือ Technology เป็นหลัก
หลักการของ Marketing ตามตำราในอดีต ประกอบด้วย 4P คือ Product, Price, Place, Promotion ซึ่งแปลง่าย ๆ เองก็ประกอบด้วยผลิตภัณฑ์หรือบริการที่จะทำการตลาด, ราคาสินค้าหรือบริการที่จะทำการตลาด, วิธีการที่จะนำสินค้าไปสู่กลุ่มเป้าหมาย หรือตลาดของตัวเอง และสุดท้ายคือการทำกิจกรรมทางการตลาด
ต่อมาจาก 4P ก็เปลี่ยนไปเป็น 7P
โดยมีส่วนที่เป็น People, Process และ Physical Evidence เพิ่มขึ้นมา (อนาคตอาจจะเพิ่มไปอีกก็แล้วเเต่ จึงไม่ควรไปยึดติด)
ซึ่งก็คือการสร้างตัวบุคคลที่จะเจอลูกค้าขึ้นมา เพื่อให้ลูกค้าเชื่อมั่น, ระบบที่สร้างความมั่นใจและความสะดวกสบายให้ลูกค้า และสถานที่ที่ลูกค้าจะมาใช้บริการได้อย่างม่ีความประทับใจ ทั้งนี้จากหลักการ 4P หรือ 7P นี้ก็มีการเปลี่ยนมาเป็นสิ่งที่เรีกยกว่า 4C
4C
Customer, Costs, Convenience, Communications
หลักการนี้เป็นการเอา 4P มาปรับให้เข้ากับยุคสมัย
โดยการทำ Product เปลี่ยนมาเป็น Customer โดยต้องดูว่า Customer มีความต้องการอะไร และอยากได้อะไร ซึ่งองค์กรจะนำเสนอผลิตภัณฑ์หรือบริการอะไรที่จะตอบสนองความต้องการของลูกค้าได้บ้าง
จาก Price เปลี่ยนมาเป็น Cost เพือดูว่ามีต้นทุนอะไรที่เกี่ยวข้องที่จะทำให้ลูกค้าเกิดความพึ่งพอใจต่อองค์กรได้ ซึ่งจะส่งผลต่อราคาต่างของสินค้าและบริการอีกด้วย
จาก Place เปลี่ยนมาเป็น Convenience โดยทำให้ลูกค้ามีความสะดวกสบายในการใช้สินค้าและบริการมากขึ้นบนสถานที่ที่ลูกค้าคิดว่าสะดวกสบาย หรือมีความต้องการที่อยากจะซื้อสินค้าและบริการในสถานที่นั้นที่สุด
Promotion มาเป็น Communication ในการสร้างการสื่อสารที่พร้อมใจกันทั้งองค์กรที่จะสื่อสารในแบบเดียวกันกับที่ลูกค้าต้องการอยากจะรู้
หลักการ Marketing นั้นต้องประกอบด้วปัจจัยต่าง ๆ ที่จะทำการตลาด สิ่งที่ทั้ง Coach, Guru หรือ Mentor ที่บอกเรื่องการทำ Facebook page, Facebook ads หรือ Content Marketing นั้นเป็นแค่ส่วนหนึ่งในการตลาดเท่านั้น
ถ้าจัดการดี ๆ จะพบว่าสิ่งที่ทำไปนั้นส่วนใหญ่เป็นเพียงสิ่งที่เรียกว่า การสื่อสารทางการตลาดเท่านั้นเอง
หรือเป็นแค่การทำการโฆษณาใน Digital เอง
ในการทำ Digital Marketing จึงมีหลักการเหมือนการทำ Marketing แต่ย้ายจากการทำบน Physical Environment มาเป็นบน Digital Environment และเปลี่ยนหลักการการสื่อสารที่เคยทำมาในแบบ Traditonal มาเป็นแบบ Digital
ยุคที่ Guru, Coach และ Mentor เฟื่องฟูกัน มีคนกลุ่มสอนอะไรที่ผิด ไปจากสิ่งที่ควรเป็น เป็นการทำลายธุรกิจของคนที่อยากจะเติบโต ทำลายวงการ Digital นอกจากนี้ยังไปสร้างความเชื่อที่ผิด ๆ ให้กับคนที่ไม่รู้ จนมีความเชื่อที่ผิด ๆ ฝังหัวกัน บางคนกลับไปเชื่อคนกลุ่มนี้ที่ไม่ได้รู้จริง เมื่อเจอคนที่ทำ digital marketing ที่แท้จริงมาแนะนำก็กลับไม่เชื่ออีก หรือสุดท้ายทำแล้วไม่เวิร์คก็โทษว่าเป็นเพราะการทำ Digital Marketing โดยที่หารู้ไม่ว่าสิ่งที่ตัวเองได้เรียนมานั้นอาจจะผิด เพราะมันเป็นความเข้าใจผิดมาตั้งแต่ Coach, Guru หรือ Mentor มาตั้งแต่ต้น การทำ Digital Marketing นั้นก็เริ่มมาตั้งแต่เรื่อง Product หรือ Service ของตัวเอง การวางกลุ่มเป้าหมาย เรื่อง Brand และการสื่อสารของตัวเอง การวางราคาของสินค้า และการวาง Channel รวมทั้งวิธีสื่อสารใน Channel ต่าง ๆ นั้นด้วย
การทำแค่อันหนึ่งอันใดใน Digital Channal จึงไม่ใช่ Digital Marketing
Digital Marketing ไม่ได้เกิดขึ้นเพราะการทำ Facebook Page, Facebook Ads หรือวิธีการใดวิธีการหนึ่ง แต่ประกอบด้วยองค์ประกอบหลาย ๆ ส่วนเข้าด้วยกันจนเป็น Digital Marketing ขึ้นมา
Guru ผู้ที่มีความรู้ความชำนาญในเรื่องใดเรื่องหนึ่งจนเป็นที่ยอมรับในวงการนั้น ๆ
Coach ครูพิเศษ ครูส่วนตัว ครูฝึก
Mentor ที่ปรึกษาที่ชาญฉลาดหรือไว้ใจได้
What’s the difference between online marketing and digital marketing?
Quite simply Online Marketing is a subset of Digital marketing.
OM refers to activities that one pursues specific to the web or internet.
On the other hand, DM also includes under its purview, significantly Mobile marketing, Video based marketing not using the Web.
Interestingly I was at an event the other day and the DJ there was including messages from brands there and calling it digital marketing, though I daresay it falls squarely in offline…
but if you look at marketing activities possible on Podcasts or HAM radio stations, I would bunch them as DM for sure.
Digital marketing is a wider term where you have to plan exectue various kind of marketing plans for websites, blogs, local marketing including Google’s Local Place Pages, AdWords, banners, and other methods of paid online advertising, and even review sites all fall under the heading of digital marketing.online media marketing is one of the components of digital marketing along with SEO, email marketing, PPV, PPC, banner advertising, mobile marketing and various forms of digital advertising – billboards, DTV (digital television), etc.
Many people use online marketing and digital marketing interchangeably because they do not realize that they have subtle but very important differences between them.
Digital marketing uses all digital channels available to communicate with the target client/audience.
This stresses the fact that no print media is used.
Included in digital marketing is Social media, Mobile marketing, SEO, QR codes, E-mail marketing etc.
This form of marketing provides a large platform for analyzing the behavior of the target client and to understand how to better target them in the future.
Online marketing, on the other hand, refers to marketing via the internet.
This includes social media, e-mail marketing and SEO.
What this does not include is mobile marketing and E-mail marketing.
Therefore, online marketing is part of a whole digital marketing campaign, yet it can stand by itself and on its own.
Digital marketing, however, requires online marketing to be complete and thorough.
online marketing :- that is a type of digital marketing using (website,social websites , email) digital marketing :- have a wide definition more than online its also include all digital aspects of marketing that may be internet enabled or not like 🙁 multimedia CD,SMS )
digital marketing means marketing of digital assets.
It can include mobile marketing etc.
Online marketing means marketing of products using online channels.
Online marketing doesn’t involve mobile marketing, etc.
Something similar to Parthasarthy’s response.
Digital marketing
online marketing (ต้องใช้ online เช่น เทคโนโลยี internet )
internet marketing (ต้องใช้ internet)
5 ดัชนีวัดผล Digital Marketing พื้นฐาน สำหรับนักการตลาด
การตลาดดิจิตัลนั้นสิ่งที่ดีมากอย่างหนึ่งก็คือ เราสามารถเก็บข้อมูลสถิติได้เป็นตัวเลขค่อนข้างหลากหลาย จึงง่ายต่อการนำมาวัดผล แต่ถ้าเราไม่ได้อยู่องค์กรใหญ่ๆเป็นแค่คนทำธุรกิจส่วนตัว หรือแบรนด์เล็กๆธรรมดาเราอาจจะยังไม่มั่นใจว่าเราควรวัดผลอย่างไรดี วันนี้ Brand Buffet มีบทความเกี่ยวกับ 5 ดัชนีหลักๆที่ควรโฟกัสในการวัดผล
Reach & Engagement – จำนวนคนเห็นและปฏิสัมพันธ์ที่เกิดขึ้น
Reach & Engagement เป็นตัวแปรที่นิยมมากในการมาใช้วัดผลเพราะข้อมูลค่อนข้างเข้าใจง่ายและมีประโยชน์ ถึงแม้ว่าเราจะเก็บข้อมูลนี้มาได้ง่ายๆแต่หลายๆครั้งเราอาจจะนำมาใช้วัดผลได้ยังไม่มีประสิทธิภาพพอ เพราะการดูแค่ว่าแคมเปญใดๆของเราได้ Reach หรือ Engagement เยอะก็ไม่ได้แปลว่าแคมเปญนั้นประสบความสำเร็จ ดังนั้น Reach & Engagement เราอาจจะเอามาใช้อ้างอิงได้ว่าแบรนด์ของเรามีสถานะโอเคมั้ยคือ มีคนเห็นมั้ย? มีคนปฏิสัมพันธ์มากมั้ย?
ซึ่งการวัดผลด้วย Reach & Engagement นั้น เราต้องกำหนดช่วงระยะเวลาในการวัดผลด้วยเช่น รายอาทิตย์ หรือรายเดือน เพื่อให้สามารถเปรียเทียบได้อย่างชัดเจน
Total Conversion (ผลตอบแทนที่เกิดขึ้นโดยรวม)
ในหลายๆที่จะมีการนำ Google Analytics มาใช้ในการวัดผลต่างๆเป็นแต่มักจะนำมาใช้วัดผลแบบผิดๆอยู่ 2 อย่างคือ
1. มองแค่ค่าเฉลี่ยโดยรวมของคนเข้าเว็บและเวลาที่อยู่ในเว็บ
2. ไม่มีเป้าหมายในการนำมาใช้ที่ชัดเจน
ถ้าเราไม่ได้กำหนดเป้าหมายไว้ เวลาเราเห็นตัวสถิติคนเข้าเว็บมามันก็จะดูเลื่อนลอยจับต้องอะไรไม่ได้เลยว่าเข้ามาเพื่ออะไร ดังนั้นการวัดผลที่ดีคือ เราต้องกำหนดเป้าหมายไว้เลยว่า คนเข้าเว็บมาแล้วเราต้องการอะไรต่อเช่น กดซื้อสินค้า, เข้าไปอ่านหน้าวิธีการสั่งซื้อ ฯลฯ เพื่อจะได้นำมาคำนวณเป็น Total Conversion ได้ในที่สุดว่ามีประสิทธิภาพแค่ไหน
Conversion rate by channel (อัตราการได้ผลตอบแทนแยกแต่ละช่องทาง)
ในกรณีที่เรามีหลายช่องทางออนไลน์เช่น Facebook , Twitter , Google ฯลฯ เราควรมีการวัดผลโดยแยกต่างช่องทางแต่ละอย่าง เพื่อให้เราสามารถเข้าใจได้จริงๆว่า แต่ละช่องทางไหนมีประสิทธิภาพมากที่สุด สิ่งนี้จะเป็นประโยชน์มากกับการคำนวณ ROI (Return on Investment) ซึ่งการวัดผลแยกแต่ละช่องทางนี้เราสามารถใช้ Google’s campaign tracking tool มาช่วยในการเก็บสถิติได้
Cost per sale/acquisition (ต้นทุนต่อยอดขาย หรือต้นทุนต่อการได้สมาชิกใหม่)
ไม่ว่าจะเป็นธุรกิจไหนก็ตาม เมื่อเราเริ่มวัดผลแคมเปญของเราแล้ว สิ่งหนึ่งที่เราควรจะวัดผลให้ได้ก็คือ ค่าใช้จ่ายที่เกิดขึ้นต่อยอดขายหรือสมาชิกใหม่ที่เข้ามา เพราะทุกวันนี้ Online Marketing มักไม่ค่อยฟรีแล้ว การที่เรารู้ว่าต้นทุนของเราที่เกิดขึ้นต่อหน่วยเป็นเท่าไหร่ ก็จะทำให้เราประเมินงบประมาณที่จำเป็นต้องใช้ได้ตรงยิ่งขึ้น เมื่อนำมาวางแผนร่วมกับเป้าหมายของธุรกิจที่เราวางไว้
Return on Investment (ผลตอบแทนจากการลงทุน)
ทุกธุรกิจต้องการรู้ว่า ผลตอบแทนจากการลงทุน เป็นเท่าไหร่? มากน้อยแค่ไหน? ดังนั้นแล้วเมื่อเรามีข้อมูลจาก 4 ข้อก่อนหน้านี้มา เราก็สามารถนำมาคำนวณหาผลตอบแทนจากการลงทุนได้ในที่สุดว่าเป็นอย่างไร
จากประสบการณ์นั้นการวัดผลบนโลกดิจิตัลนั้น สามารถวัดผลได้หลากหลายมากเพราะข้อมูลต่างๆค่อนข้างเก็บเป็นสถิติเชิงตัวเลขได้เยอะ แต่ข้อผิดพลาดที่มักจะเกิดขึ้นบ่อยครั้งก็คือว่า เราอาจจะโฟกัสที่จำนวนตัวเลขผิดตัวแปรที่ไม่ตรงกับเป้าหมายของธุรกิจ นั่นอาจทำให้กลายเป็นว่า กว่าจะรู้ตัวอีกทีก็ทำให้เราเสียทั้งเวลาและเดินไปทิศทางแล้วก็ได้
วันนี้ Blog ถูกยกเป็นเครื่องมือที่มีอิทธิพลต่อการตัดสินใจซื้อของผู้บริโภคมากกว่านิตยสารถึง 63% ขณะที่ 58% ของชาวออนไลน์มักจะหมดความอดทนและปิดวิดีโอภายในช่วง 90 วินาที ขณะที่ 67% ของนักช้อปออนไลน์ยอมรับว่าภาพสินค้าที่สวยงามมีคุณภาพคือสิ่งสำคัญที่สุดที่ทำให้ตัดสินใจซื้อ
สถิติเหล่านี้มาจากเว็บไซต์ Mindoptimind.com ซึ่งเป็นข้อเท็จจริงที่เกิดขึ้นในการทำการตลาดผ่านสื่อดิจิตอลในรูปแบบต่างๆ ที่เราคุ้นเคยกันดีอย่างอีเมล, บล็อก, โพสต์ รวมถึงวิดีโอ โดยสถิติทั้งหมดที่นำเสนอจะช่วยให้เราเข้าถึงการใช้งานสื่อดิจิตอลในแต่ละรูปแบบได้ชัดเจนยิ่งขึ้น
เริ่มต้นกันด้วยการนำเสนอในรูปแบบ “อีเมล (E-mail)” ถึงแม้ในระยะหลังการทำการตลาดผ่านอีเมลจะไม่ค่อยถูกพูดถึงมากนัก แต่อีเมลก็ยังคงเป็นรูปแบบในการนำเสนอที่ได้รับความนิยมอย่างต่อเนื่อง โดยสาเหตุสำคัญก็คือ ประสิทธิภาพในการใช้งานและให้ผลตอบแทนในการลงทุนที่คุ้มค่า ผลการสำรวจพบว่าการใช้งานอีเมลปัจจุบันให้ผลตอบแทนในการลงทุนสูงถึง 44.25 เหรียญสหรัฐต่อการลงทุนเพียง 1 เหรียญสหรัฐเท่านั้น
ต่อกันด้วย “บล็อก (Blog)” บล็อกนับว่าเป็นอีกช่องทางสำคัญที่กลุ่มธุรกิจหันมาใช้เพื่อนำเสนอข้อมูลเพิ่มมากขึ้น ซึ่งบล็อกช่วยเพิ่ม Indexed Link ได้มากถึง 97% รวมถึง Indexed Page อีกสูงถึง 367% และที่สำคัญบล็อกยังเป็นสื่อที่มีอิทธิต่อการตัดสินใจซื้อสินค้าของผู้บริโภคมากถึง 63% ซึ่งมากกว่าช่องทางอื่นๆ อย่างเช่น นิตยสารอีกด้วย
“โพสต์ (Post)” หมายถึง การโพสต์บทความต่างๆ บนโซเชียลมีเดียรวมถึงบนเว็บไซต์และสื่อออนไลน์ต่างๆ ซึ่งความเหมาะสมในการโพสต์นอกจากจะต้องสื่อสารใจความสำคัญได้อย่างครบถ้วนและตรงประเด็นแล้ว สิ่งสำคัญที่ต้องนึกถึงอยู่เสมอ คือ ความยาวของเนื้อหาที่นำเสนอ ผลการสำรวจพบว่า บทความที่โพสต์มีความยาวมากกว่า 2,000 คำขึ้นไป (ภาษาอังกฤษ) จะช่วยให้บทความติดอันดับอยู่ใน 10 อันดับแรกบน Google ได้ง่ายยิ่งขึ้น
ไม่เพียงเท่านั้นการนำรูปภาพมาเป็นส่วนประกอบในบทความก็เป็นส่วนหนึ่งที่ช่วยเพิ่มการมองเห็นจากผู้ชมได้มากถึง 92% แต่หากธุรกิจรู้สึกเบื่อกับการรูปการโพสต์บทความหรือรูปภาพในแบบเดิมก็สามารถเปลี่ยนรูปแบบการนำเสนอเป็นอินโฟกราฟฟิก (Infographic) ที่เป็นผสมผสานทั้งรายละเอียดและรูปภาพไว้ได้อย่างลงตัวมานำเสนอได้เช่นกัน
ปิดท้ายด้วยการนำเสนอในรูปแบบ “วิดีโอ (Video)” การสื่อสารโดยใช้วิดีโอนั้น เป็นรูปแบบในการนำเสนอที่ถูกพูดถึงและได้รับความนิยมมาตลอดหลายปีที่ผ่านมา สาเหตุสำคัญที่ทำให้วิดีโอยังคงเป็นช่องทางในการนำเสนอที่ได้รับความนิยมในอันดับต้นๆ นั่นก็คือ ประสิทธิภาพในการสื่อสารที่มีความสมบูรณ์แบบ โดยผู้ชมที่ชมเนื้อหาผ่านวิดีโอสามารถจดจำเนื้อหาที่นำเสนอได้มากถึง 58% ในขณะที่การนำเสนอผ่านตัวอักษรผู้ชมกลับสามารถจดจำเนื้อหาได้เพียง 10% เท่านั้น
ประสิทธิภาพของการนำเสนอด้วยวิดีโอไม่เพียงแค่ช่วยดึงดูดความสนใจและเพิ่มการจดจำได้เท่านั้น แต่ยังช่วยเพิ่มอัตราการกดลิงก์เข้าสู่เว็บไซต์, เพิ่มอันดับในการแสดงผลบนเสิร์ชเอนจิ้นให้สูงขึ้น รวมถึงเพิ่ม Conversion กับธุรกิจที่ใช้วิดีโอมานำเสนอบน Landing Page ได้มากถึง 86%
ข้อมูลทั้งหมดที่นำเสนอเป็นเพียงส่วนหนึ่งของสถิติทั้งหมดที่เกิดขึ้นในแวดวง Digital Marketing ทั้ง 4 รูปแบบ
Social Media เติบโตอย่างต่อเนื่อง และเปลี่ยนพฤติกรรมของผู้ใช้ Internet รวมถึงเปลี่ยนแปลงพฤติกรรมการใช้มือถือและอุปกรณ์ต่างๆ
ข้อมูลจาก Nielsen Wire ตัวเลขเมื่อเดือนมิถุนายน มีความน่าสนใจจากหลายๆ ส่วนถึงการเติบโตเข้าสู่การเป็น Mainstream web Technology เป็นที่เรียบร้อยแล้ววันนี้ไม่มีคนออนไลน์คนไหนใครไม่รู้จัก Facebook
1. Social Media Networks และ Blogs กินเวลา 25% ของคนออนไลน์ไปแล้ว
2. ผู้ใช้ Internet ทั้งโลกใช้เวลา 110,000,000,000 นาที บนเครือข่ายชุมชน Social Media และเว็บไซต์บล็อก
3. ตัวเลขการเข้าชมเว็บไซต์ Social Media โตขึ้นถึง 24 % ในปีที่ผ่านมา
4. ผู้เข้าอินเตอร์เน็ตใช้เวลาบนเว็บไซต์ Social Media และ Blog มาขึ้นถึง 66% เมื่อเทียบกับปีที่แล้ว
5. ประเทศบราซิล เป็นประเทศอันดับต้นๆ ที่มีประชากร Internet สูงถึง 86% เข้าใช้งาน Social Media ในขณะที่ USA ตัวเลขอยู่ที่ 74%
6. ไม่น่าเชื่อว่าประเทศญี่ปุ่นเป็นประเทศที่มี Active User ที่ใช้งาน Facebook เพียงแค่ 3% เท่านั้น
7. Ameba เว็บไซต์ประเภท microblogging เช่นเดียวกับ Twitter สัญชาติ ญี่ปุ่น เติบโตอย่างต่อเนื่องและปัจจุบัน มีผู้ใช้ถึง 38% ของประชากรอินเตอร์เน็ตชาวญี่ปุ่นทั้งหมด
8. ผู้ใช้ Social Network ชาวออสเตรเลียคือประเทศที่ใช้เวลาบน social networking สูงที่สุดถึง 7 ชั่วโมง 19 นาที / เดือน ในขณะที่ชาวมะกัน ใช้กันที่ 6.30 ชั่วโมงต่อเดือน
9. Facebook สามารถขยายผู้ใช้ได้มากที่สุดในอิตาลี และ Active User มีสูงถึง 2 ใน 3 ของผู้ใช้ทั้งหมด ซึ่งสูงกว่าในกลุ่มประเทศ USA, Australia and the UK ถึง 60
10.อันนี้คือตัวเลขที่บ่งบอกได้ว่า มันกลายเป็นส่วนหนึ่งของโลกใบนี้ไปแล้ว เมื่อ Facebook กลายเป็น Social Media ที่มีคนเข้าสูงสุดและ เข้าถึงกลุ่มผู้ใช้งานอินเตอร์เน็ตทั่วโลกถึง 54%
 DIGITAL ADVERTISING และแนวคิดสำคัญจากงาน DAAT DAY 2016
ทุกๆ ปี สมาคมโฆษณาดิจิทัลหรือ DAAT ก็จะมีการจัดงาน DAAT Day ที่เรียกว่าเป็นการอัพเดทสถิติสำคัญของการตลาดดิจิทัลเช่นเดียวกับการพบปะบรรดานักคิดดังๆ ในอุตสาหกรรมกัน ผมเลยขอเอาข้อมูลน่ารู้ที่ถูกอัพเดทมาสรุปกันหน่อยแล้วกันนะครับ
1. Digital Media Spending โตขึ้น (อีกนั่นแหละ)
ข้อนี้ผมไม่คิดว่าเป็นเรื่องแปลกอะไร เพราะเอาจริงๆ สื่อดิจิทัลนั้นเริ่มขึ้นช้ากว่าสื่อประเภทอื่นๆ และแบรนด์ต่างๆ ก็กระโจนเข้ามาเช่นเดียวกับการใช้งานของผู้บริโภคที่โตแบบก้าวกระโดด
จากสถิติของ DAAT นั้นก็เห็นได้ว่าเม็ดเงินโฆษณาดิจิทัลนั้นโตขึ้นสวนทางกับตลาดอื่นๆ ที่ดูลดลง สิ่งที่น่าสนใจคือเราเริ่มเห็นหลายๆ อุตสาหกรรมที่กระโดดเข้ามาในดิจิทัลมากกว่าเดิม เช่น Dealer รถยนต์ที่มีการเติบโตสูงสุด (มากกว่า 4,000%) หรือกลุ่มอาหารเสริม เครื่องสำอาง ซึ่งจะว่าไปแล้วก็เพราะอุตสาหกรรมเหล่านี้ต้องการช่องทางในการที่มี “ปฏิสัมพันธ์” และ “สื่อสาร” กับกลุ่มเป้าหมายมากกว่าสื่อเก่าๆ ที่จะมีข้อจำกัดในการให้ข้อมูลต่างๆ นอกจากนี้แล้วสื่อดิจิทัลกลายเป็นสื่อที่มีอิทธิพลกับกลุ่มเป้าหมายมากกว่าสื่ออื่นๆ อีกด้วย
ไม่ใช่เรื่องแปลกที่ตัวเลขของ Spending นั้นจะสูงขึ้นกว่าเดิม (ถ้าตกลงน่ะสิแปลก) เพราะแบรนด์เองก็เริ่มคุ้นเคยกับการซื้อสื่อดิจิทัลมากขึ้น มีความรู้มากขึ้น เช่นเดียวกับกระแสพฤติกรรมผู้บริโภคเองที่ก็กลายเป็นตัวนำ (แกมบังคับ) ให้ลูกค้าต่างๆ ต้องโยกเงินมาดิจิทัลให้มากกว่าเดิม
อย่างไรก็ตาม สิ่งที่เราต้องคิดไว้เสมอคือตัวเลขดิจิทัลนั้นยังไม่ใช่ตัวเลขจริงของอุตสาหกรรมเพราะมันยังมีหลายแบรนด์ที่ทาง DAAT ไม่สามารถเก็บข้อมูลได้ เช่นมีการจ่ายเงินตรงให้กับผู้ให้บริการอย่าง Facebook หรือ Google ตลอดไปจนผู้ประกอบการขนาดกลางและขนาดเล็กที่มีเม็ดเงินหมุนเวียนอีกมหาศาล (เอาแค่คนขายครีมหรืออาหารเสริมออนไลน์นี่ก็เพียบแล้ว)
หลักการสำคัญของการเลือกสื่อคือการประเมิน Quality และ Influence Score ของตัว Media ที่มีต่อกลุ่มเป้าหมายของเราเป็นสำคัญ เช่นเดียวกับการวาง Strategy ด้วย เพราะถ้าแผนตั้งต้นผิด ทุกอย่างก็ผิดหมด
2. AI / Machine Learning จะเป็นเทคโนโลยีการตลาดยุคใหม่
มีการพูดถึง Chat Bot และ AI อยู่หลายครั้ง ซึ่งนั่นก็เป็นอีกขั้นหนึ่งของเทคโนโลยีที่สามารถเข้ามาตอบโจทย์ในการสร้างประสบการณ์ให้กับลูกค้ามากขึ้นกว่าเดิม เช่นการใช้ Chat Bot ในการโต้ตอบแก้ปัญหากับลูกค้า การใช้ Bot ใน Facebook Messenger เพื่อสั่งซื้อสินค้า หรือแม้แต่ LINE เองมีการผนวก AI เข้ามาใช้กับ Official Account ซึ่งสามารถใช้เป็นช่องทางในการโต้ตอบ สอบถามข้อมูล และสั่งซื้อสินค้าได้โดยตรงกับทาง Offcial Account ผ่านการคุยกับโปรแกรมที่ถูกตั้งไว้นั่นเอง
บรรดา AI ทั้งหลายก็กำลังทำหน้าที่หลักในการ Automate สิ่งที่เราเคยจำเป็นต้องใช้คนในการดำเนินการซึ่งจำเป็นต้องมีขั้นตอนที่ใช้เวลาและทรัพยากรค่อนข้างเยอะ การมี Automation นั้นทำให้เราสามารถบีบขั้นตอนต่างๆ ให้เรียบง่ายกว่าเดิม รวดเร็วกว่าเดิม ซึ่งทำให้เกิดรูปแบบบริการใหม่ๆ ได้มากขึ้นทันที
3. Programmatic Buying จะเป็นเรื่องที่ต้องรู้
การซื้อสื่อดิจิทัล ในแวดวงเอเยนซี่และนักการตลาดดิจิทัลคงไม่พูดกันเรื่อง “ซื้อ Facebook” หรือ “ซื้อ Google” แต่ก้าวไปสู่การซื้อแบบ Programmatic กัน ซึ่งทำให้นักการตลาดสามารถซื้อสื่อได้สลับซับซ้อนกว่าเดิมแต่ก็สามารถทำได้รวดเร็วกว่าเดิมด้วย
Programmatic นั้นคืออนาคตของการซื้อสื่อโฆษณา เพราะมันทำให้นักการตลาดมีอาวุธในการซื้อสื่อมากขึ้นกว่าเดิม สามารถพลิกแพลงและปรับแผนได้ละเอียดกว่าการทำ Mass Communication แบบเดิม การเลือกเข้าถึงกลุ่มเป้าหมายโดยอิงตาม “ข้อมูล” ที่ตัวเองมีทำให้ลดการใช้สื่อที่ไม่จำเป็นออกไป รวมถึงการปรับตัว Message ให้มีความเป็น Personalized มากขึ้นอีกด้วย
แม้ว่าทุกวันนี้ Programmatic อาจจะเป็นเรื่องใหม่สำหรับนักการตลาดในไทย แต่ผมบอกได้เลยว่าในระดับนานาชาตินั้นเป็นเรื่องใหญ่และบริษัทจำนวนมากก็กำลังปรับวิธีการซื้อสื่อไปสู่ Programmatic กันแล้ว เช่นเดียวกับสื่อ Offline บางสื่อเองก็เริ่มเอาเทคโนโลยี Programmatic มาใช้อีกด้วย
4. Content is (always) King, and it’s not advertising
ท้ายที่สุด ในการสื่อสารการตลาดนั้น เราก็ยังไม่สามารถขาด Content ได้ แต่ทุกวันนี้นักการตลาดอาจจะเริ่มรู้ตัวกันแล้ว (เสียที) ว่าการตลาดไม่ใช่เรื่องของการโฆษณาแบบเดิมๆ โดยเฉพาะกับบริบทปัจจุบันที่คนเริ่มเอียนและปฏิเสธโฆษณาจากแบรนด์ การสร้างคอนเทนต์ให้มีความแตกต่าง น่าติดตาม จึงเป็นโจทย์ที่แบรนด์ต้องหันมาทำกันอย่างจริงจัง ไม่ว่าจะอยู่บน Platform ออนไลน์หรือออฟไลน์
การให้ความสนใจกับมุมมองคอนเทนต์ที่ไปไกลกว่าโฆษณาอาจจะถือเป็นเรื่องใหม่ของนักการตลาดที่คุ้นเคยกับการโฆษณามาหลายสิบปี นั่นคืออนาคตของสื่อสารการตลาดที่เราต้องผันตัวเองจาก Advertiser ไปสู่ Publisher กันมากขึ้น
http://www.nuttaputch.com/
ทั้งนี้อุปสรรคที่เอเยนซี่มองว่าทำให้ลูกค้ายังไม่ใช้เงินกับโฆษณาดิจิทัลในสัดส่วนที่มากอย่างที่ควรจะเป็นนั้น เกิดจากความยังไม่เข้าใจสื่อดิจิทัลมากพอ และผลสำรวจพบว่าลูกค้าส่วนใหญ่จะใช้งบโฆษณาดิจิทัลเพื่อวัตถุประสงค์ในการสร้างการรับรู้ให้กับแบรนด์ และสร้างความสัมพันธ์ระหว่างแบรนด์กับผู้บริโภค
นพ.ศุภชัย ปาจริยานนท์ นายกสมาคมโฆษณาดิจิทัล (ประเทศไทย) เปิดเผยว่า สื่อโฆษณาดิจิทัลยังเติบโตอย่างต่อเนื่องสอดคล้องกับยอดผู้ใช้งานอินเทอร์เน็ตและโซเชียลเน็ทเวิร์คที่เพิ่มขึ้นแบรนด์ต่างๆมีการกำหนดวัตถุประสงค์ทางการตลาดที่ชัดเจนมากยิ่งขึ้น ไม่เพียงการสร้างความรู้และสร้างความสัมพันธ์กับผู้บริโภคเท่านั้น แต่รวมไปถึงการสร้างยอดขายผ่านอีคอมเมิร์ซและการเพิ่มจำนวนลูกค้าเป้าหมาย (Lead Generation) ผ่านสื่ิอดิจิทัล ผลสำรวจยังชี้ให้เห็นอีกว่า เครื่องมือสำหรับนักการตลาดที่สำคัญในอนาคตอันใกล้ได้แก่ การวิเคราะห์ข้อมูลเชิงลึก (Data Analytic) และ โซเซียล ลิสเทนนิ่ง (Social Listenting) ซึ่งล้วนแล้วแต่จะช่วยทำให้การใช้สื่อดิจิทัลมีประสิทธิภาพสูงสุด
คุณนรสิทธ์ สิทธิเวชวิจิตร อุปนายกสมาคมโฆษณาดิจิทัล(ประเทศไทย) ชี้แจงเพิ่มว่าจากการสำรวจในปีนี้ของทางสมาคม เห็นได้ชัดเจนว่า สื่อดิจิทัลได้ก้าวขึ้นมาเป็น สื่อหลักเทียบเคียงกับสื่อโทรทัศน์ โดยเฉพาะอุตสาหกรรมที่ใช้เม็ดเงินโฆษณากับสื่อโทรทัศน์เป็นหลัก อย่าง ผลิตภัณท์บำรุงเส้นผม เครื่องประทินผิว ยานยนต์ และ เครื่องดื่มไร้แอลกอออล์ มีการเพิ่มขึ้นของ สื่อออนไลน์วีดีโอมากที่สุด ส่วนสื่อที่ได้รับความนิยมเพิ่มขึ้นในทุกช่วงอายุอย่าง ไลน์ (LINE) ก็มีการเติบโตอย่างก้าวกระโดด ซึ่งชี้ให้เห็นว่า นักการตลาดเมืองไทยมีความเร็วของปรับเปลี่ยนสื่อ ให้ตรงกับ พฤติกรรมของผู้บริโภคที่เปลี่ยนแปลงไปอย่างรวดเร็วมากยิ่งขึ้น
คุณกิตติ เศรษฐวีรวัฒน์ ผู้อำนวยการด้านเทคโนโลยี และดิจิทัล ทีเอ็นเอส ไทยแลนด์หัวหน้าโครงการสำรวจฯกล่าวว่าข้อมูลงบประมาณและการใช้จ่ายด้านสื่อต่างๆ เป็นข้อมูลที่สำคัญต่อนักการตลาด และนักโฆษณาประชาสัมพันธ์ ในการตัดสินใจทางธุรกิจ ซึ่งในปัจจุบันสื่อดิจิทัลมีบทบาทต่อผู้บริโภคในการสร้างการรับรู้ต่อตราสินค้า/บริการ และต่อการตัดสินใจซื้อสินค้า/บริการเป็นอย่างมาก โดยในช่วงห้าปีที่ผ่านมา (ภายหลังการเข้ามา และได้รับความนิยมของ Smart Phone ในประเทศไทย) การบริโภคสื่อ Traditional Media ของผู้บริโภคได้แบ่งสัดส่วนการบริโภคให้กับสื่อ Digital Media เพิ่มมากขึ้นเป็นลำดับ ในขณะที่ข้อมูลการใช้จ่ายและงบประมาณด้านสื่อ Digital Media มีอยู่อย่างจำกัด และกระจัดกระจาย ในช่วงเวลาดังกล่าว ซึ่งในการสำรวจปีนี้ได้จัดทำขึ้นในมิติที่หลากหลายอาทิการลงรายละเอียดในข้อมูลเกี่ยวกับโซเชียลมีเดีย แพลทฟอร์ม อย่าง Facebook, Display, YouTube และ LINEโดยเฉพาะเป็นต้น ในรูปแบบของรายงานและข้อมูลดิบผู้สนใจรายงานฉบับเต็มพร้อมด้วยข้อมูลดิบสามารถดูข้อมูลเพิ่มเติมได้ที่ www.tnsglobal.com/thailand-digital-ad-spend-report
เกี่ยวกับสมาคมฯ
สมาคมโฆษณาดิจิทัล (ประเทศไทย) หรือ Digital Advertising Association (Thailand) (DAAT) ก่อตั้งขึ้นอย่างเป็นทางการในเดือนตุลาคม 2555 โดยมีวัตถุประสงค์หลักของสมาคมคือ เพื่อเผยแพร่คุณค่าของงานโฆษณาดิจิทัล, เพื่อเพิ่มประสิทธิภาพและขยายความต้องการของงานโฆษณาดิจิทัล, และสร้างความเข้าใจอันดีซึ่งกันและกันระหว่างสมาชิก รวมทั้งเพิ่มพูนมาตราฐาน ข้อกำหนดต่างๆ ในวิชาชีพของการโฆษณาดิจิทัล ปัจจุบันมีสมาชิกของสมาคมฯ กว่า 60บริษัท สำนักงานใหญ่ของสมาคมตั้งอยู่ ณ เลขที่ 2 อาคารเพลินจิตเซ็นเตอร์ ชั้นG ถ.สุขุมวิท แขวงคลองเตย เขตคลองเตย กรุงเทพมหานคร 10110 และเว็บไซต์ของสมาคม www.daat.in.th
เกี่ยวกับทีเอ็นเอส
ทีเอ็นเอส เป็นหนึ่งในบริษัทวิจัยชั้นนำระดับโลก ด้วยเครือข่ายสำนักงานในกว่า 80 ประเทศที่มีความเชี่ยวชาญในงานวิจัยทางการตลาดเพื่อให้คำปรึกษาเรื่องกลยุทธ์การเติบโตทางธุรกิจในหลากหลายด้าน อาทิ การขยายธุรกิจเข้าสู่ตลาดใหม่ การพัฒนานวัตกรรมสินค้า แบรนด์และการสื่อสารการตลาด การพัฒนาความสัมพันธ์ลูกค้าและพนักงานในองค์กร ด้วยความเชี่ยวชาญของทีมวิจัยและโซลูชั่นด้านการวิจัยที่ได้รับการยอมรับทั้งในเชิงปริมาณและคุณภาพ เพื่อช่วยให้ลูกค้าได้รับข้อมูลอย่างครบถ้วนประกอบการตัดสินใจทางธุรกิจ ทีเอ็นเอส เป็นส่วนหนึ่งของกลุ่มบริษัทกันตาร์ (Kantar) ซึ่งเป็นกลุ่มให้คำปรึกษา ข้อมูล และการวิเคราะห์เจาะลึกในเครือ WPP อ่านรายละเอียดเพิ่มเติมเกี่ยวกับ TNS ได้ที่ www.tnsglobal.com
Download Report Mid Year 2016 Digital Ad Spend
Download infographic
Buy full report www.tnsglobal.com/thailand-digital-ad-spend-report
http://www.daat.in.th/index.php/daat-digital2016/
Business planning and goal setting for digital marketing and SEO can be challenging in the rapidly changing online world. To assist in the process I have located and compiled a wide range of stats covering the areas of SEO, content marketing, email marketing, social media, Internet growth and e-commerce.
Each of the 150 statistics is followed by a link to the source for the given statistic. Each source will provide additional information and potentially some added context. Solid information will help turn dollars spent on SEO and digital marketing into business success.
A goal with this post was to compile hard numbers and statistics, while avoiding opinions and conjectures, to help readers establish a clearer baseline for 2016.
Where do these 150 SEO & Digital Marketing Statistics Come From?
The Internet abounds with statements on size, market share, growth rate, past and projected revenue, number of active users and much more. A pet peeve of mine is that all too frequently the statements and supposed facts I read online provide no source or attribution.
A common question after reading these standalone statements masquerading as facts is to ask “says who”? Or, “where do these numbers come from.” A goal of this post is to include answers to the “says who?” question and every statistic cited here lists a source.
Another consistent challenge I found in compiling these statistics is the age of the information. During my research for this post I came across a number of interesting statistics only to find that when I checked the sources the data was from three to six years old. Given the rapid rate of change in the online world citing a statistic from 2011 or 2012 often provides limited value. The vast majority of the statistics in this post are from the last 12-15 months.
Given the large amount of data available on the web the statistics below represent only a narrow snapshot. If you have another useful stat or an excellent resource for more info please leave a comment. The stats below are divided in 6 sections. Some items could fit in multiple sections so I had to make some judgement calls. Enjoy.
SEO & Search Statistics
Takeaway: SEO delivers real value for businesses of all sizes; content marketing and SEO are 2 pieces of the same solution. (See more in the next section on Content Marketing statistics)
SEO Statistics 2016 Web Presence Marketing Services1. 72% of marketers worldwide said relevant content creation was the most effective SEO tactic according in a June 2015 report from Ascend2. (Source: MarketingProfs)
2. In the same Ascend2 report 48% of respondents identified keyword/phrase research as a most effective SEO tactic with 34% citing frequent website updates. (Source: MarketingProfs)
3. The average word count on pages in the top 10 search results has increased by around a quarter – rising from 975 in 2014 to 1,285 words in 2015. (Source: SearchMetrics)
4. A July 2015 study by Moz and BuzzSumo analyzed the shares and links of over 1 million articles and found that long form content of over 1,000 words consistently receives more shares and links than shorter form content (Source: Moz)
5. 86% of B2B marketers and 77% of B2C marketers use content marketing. (Source: Content Marketing Institute)
Search & SEO Statistics:
6. Google gets over 100 billion searches a month worldwide. (Source: Mashable)
7. As of May 2015 more Google searches take place on mobile devices than on computers in 10 countries including the US and Japan. (Source: Google)
8. In November 2015, Google’s Desktop market share was 64%, compared with 21% for Microsoft and 12.5% for Yahoo. (Source: Comscore)
9. Google had 94% of the worldwide mobile (smartphone and tablet) search market share in December 2015. (Source: NetMarketshare)
10. February 2015 polling by Econsultancy showed that 73% of in-house marketers and 76% of US agencies said SEO provided excellent or good return on investment (ROI). (Source: eMarketer)
11. June 2015 research of marketers by Ascend2 showed 89% worldwide rated SEO successful at achieving objectives of improved search rankings, website traffic and lead generation. (Source: eMarketer)
12. According to research from RBC Capital Markets conducted in September 2015, 64% of US small and medium-sized businesses had a professional website for their business, and an additional 10% planned to create one. (Source: eMarketer)
13. 25% of all websites globally use WordPress as their development platform as of November 2015 (Source: W3Techs)
14. Among the group of SMBs (small and medium size businesses) that had or planned to create a website, just 33% had a mobile-optimized site in September 2015. (Source: eMarketer)
15. Of the small businesses with websites 10% updated their site at least once a week, 33% at least once a month, and 21% once per year or longer. (Source: eMarketer)
16. In the May 2015 survey from BrightLocal 61% of consumers said that they are more likely to contact a local business if they have a mobile optimized site. (Source: BrightLocal)
17. 18% of local smartphone searches led to a purchase within a day compared to 7% on non-local searches. (Source: Google)
18. 71% of B2B researchers start their research with a generic search. (Source: Google)
19. The average human attention span in 2000 was 12 seconds, but by 2013 it was only 8 seconds. (Source: Microsoft)
20. The number of mobile-only Internet users now exceeds desktop-only users in the U.S. as of March 2015. (Source: Comscore)
21. 72% of consumers who did a local search visited a store within 5 miles. (Source: Wordstream)
22. 43% of consumers do online research while in the store. (Source: Wordstream)
23. 57% of customers say they won’t recommend a business with a poorly designed mobile site and 40 percent have turned to a competitor’s site after a bad experience. (Source: Google)
24. 1 in 3 smartphone searches were made right before a store visit. (Source: Google)
25. 4 in 5 consumers conduct local searches on search engines – 88% on smartphones, 84% on computer/tablet. (Source: Google)
26. 50% of consumers visit a store within a day of their local search on a smartphone. (Source: Google)
27. 34% of consumers visit a store within a day of their local search on a computer or tablet. (Source: Google)
28. 77% of mobile searches are made where a desktop PC is available. (Source: Google & Nielsen)
29. 52% of mobile users consider the physical address to be the most important piece of information on a local business website and 47% said that map/driving directions are most important. 44% say opening hours are most important & 37% say a phone number according to May 2015 Survey by BrightLocal. (Source: BrightLocal)
30. 48% Identified keyword/phrase research as a most effective SEO tactic with 34% citing frequent website update. (Source: MarketingProfs)
31. Changing search algorithms (40%) and budget constraints (38%) are considered the most challenging obstacles to SEO success. (Source: Marketing Charts)
32. More than 7 in 10 respondents feel that their SEO effectiveness is improving either significantly (15%) or modestly (56%). (Source: Marketing Charts)
33. On average, B2B influencers do 12 searches prior to visiting a specific brand’s site. (Source: Google)
34. Those involved in the B2B buying process are already 57% of the way down the path to a decision before they’ll actually perform an action on your site. (Source: Google)
35. 90% of B2B researchers who are online use search specifically to research business purchases. (Source: Google)
36. 49% of B2B researchers who use their mobile devices for product research do so while at work. (Source: Google)
Content Marketing Statistics
Takeaway: Content marketing and SEO are 2 pieces of the same solution. Both are needed as part of a successful online strategy. As defined by the Content Marketing Institute, “Content marketing is a marketing technique of creating and distributing valuable, relevant and consistent content to attract and acquire a clearly defined audience – with the objective of driving profitable customer action.”
Content-Marketing-Statistics-Small-Business-SEO-2016-Web-Presence37. A July 2015 study by Moz and BuzzSumo analyzed the shares and links of over 1 million articles and found that long form content of over 1,000 words consistently receives more shares and links than shorter form content (Source: Moz)
38. In the same study by Moz and BuzzSumo in a randomly selected sample of 100,000 posts over 50% had 2 or less Facebook interactions (shares, likes or comments) and over 75% had zero external links. This suggests there is a lot of very poor content out there and also that people are very poor at amplifying their content. (Source: Moz)
39. In a September 2015 study by the Content Marketing Institute (CMI) and MarketingProfs, 76% of B2B marketers in North America said they expect to create more content in 2016 than they did in 2015. (Source: eMarketer)
40. 45% of marketers say blogging is their #1 most important content strategy. (Source: Social Media Examiner)
41. 69% of marketers say they plan to increase their use of blogging this year. (Source: Social Media Examiner)
B2B Content Marketing Stats
42. 85% of B2B marketers say lead generation will be their most important content marketing goal in 2016. Sales will be their second priority. (Source: Content Marketing Institute)
43. 88% of B2B marketers currently use content marketing as part of their marketing strategy, yet only 32% have a documented content marketing strategy. (Source: Content Marketing Institute)
44. In a July 2015 Ascend2 study of B2B marketing professionals, 43% of respondents asserted that content marketing was one of the most effective tactics for lead generation. (Source: eMarketer).
45. 60% of B2B marketers report that their top challenge in 2016 will be producing engaging content. 57% say measuring content effectiveness will be their greatest challenge. (Source: Content Marketing Institute)
46. 88% of B2B companies report using content marketing, with 76% saying they will produce more content in 2016. (Source: Content Marketing Institute)
47. 60% of B2B companies say the biggest challenge in creating new assets is producing engaging content. (Source: Content Marketing Institute)
48. 85% of B2B companies say lead generation is the most important goal for content marketing, with 31% saying lead quality is the most important metric to study. (Source: Content Marketing Institute)
49. 76% of B2B marketers in North America said they expect to create more content in 2016 than they did in 2015 according to a September 2015 study by the Content Marketing Institute (CMI) and MarketingProfs. (Source: eMarketer).
B2C Content Marketing Stats
50. Compared to 2015, 77% of B2C marketers say they will produce more content in 2016. Only 2% will produce less. (Source: Content Marketing Institute)
51. The most effective content marketing strategy for B2C businesses is eNewsletters (61% of marketers say these are effective). Other effective strategies are in-person events (67%), illustrations/photos (66%) and social media content (66%). (Source: Content Marketing Institute)
52. The most popular social media platform among B2C businesses is Facebook, with 94% of respondents reporting its usage. Other popular platforms are Twitter (82%), YouTube (77%) and LinkedIn (76%). (Source: Content Marketing Institute)
53. 66% of B2C marketers say Facebook is their most effective social platform; this is followed by YouTube (53%), Twitter (50%) and Instagram (42%). (Source: Content Marketing Institute)
54. The #1 content marketing goal for B2C businesses in 2016 is sales (83%), followed by customer retention and loyalty (81%) and engagement (81%). (Source: Content Marketing Institute)
Email Marketing Statistics
Takeaway: Email marketing works and deliver strong ROI. “The Direct Marketing Association says email marketing returns $43 for every dollar invested in it. While that’s incredibly impressive, it’s even more impressive when you realize that figure averages in a lot of low-performing programs. There are some brands that are generating email marketing ROIs of $80, which they’re achieving with aggressive, smart spending on technology and services.” (Source: Media Post EmailInsider)
Email-marketing-Statistics-2016-SEO-Small-Business54. The forecasted number of e-mail users worldwide by 2016: 2.76 billion. (Source: Statista)
55. Projected number of e-mail users in the U.S. by 2019: 251.7 million. (Source: Statista)
56. Gmail has over 900 million active users as of May 2015. (Source: TechCrunch)
57. 75% of Gmail users open their email on a mobile device as of May 2015. (Source: TechCrunch)
58. 51.7% of emails were opened on smartphones and 15% were opened on Tablets, with 33.3% opened on desktop/laptop computers according to Movable Ink’s US Consumer Device Preference Report for Q3 2015. (Source: Movable Ink)
59. In the same Movable Ink report they found 41.4% of email opens occurred on an iPhone. (Source: Movable Ink)
60. According to findings by The Relevancy Group in April 2015, US marketing executives believe that email marketing alone drives the same level of revenue as their social media, website and display ad efforts combined. (Source: eMarketer)
61. In the Email Marketing Industry Census 2015, eConsultancy & Adestra found that among digital marketers 79% ranked ROI from email “good” or “excellent”, 76% ranked ROI from SEO “good” or “excellent”, and 35% ranked ROI from social media as “good” or “excellent”. (Source: Movable Ink)
62. The open rate for e-mails with a personalized message was 17.6%, as compared to 11.4% without any personalization. (Source: Statista)
63. Email marketing was the biggest marketing channel on Black Friday 2015, driving 25.1% of all transactions, according to Custora. Beyond email 21.1% of sales originated through organic search and 16.3% through paid search, while social media (including Facebook, Twitter, Instagram, and Pinterest) drove only 1.7% of sales. (Source: Custora)
64. 72% of consumers chose email when asked, “In which of the following ways, if any, would you prefer companies to communicate with you?” according to MarketingSherpa. Postal mail was a distant second with 48% of respondents. (Source: Marketing Sherpa)
65. A survey by Bizrate Insights found that 23% of potential online buyers purposely abandon their shopping carts in order to collect coupons that sellers send to try and close the sale. (Source: E-Consultancy)
66. Based on Q3 2015 data from SaleCycle, when retailers send email notifications about abandoned carts, the emails have a healthy 40.5% open rate. (Source: eMarketer)
67. Listrak reported that in Q2 2015 open rates for US shopping cart abandonment email campaigns averaged 28.0% among its clients with a 21.0% conversion rate. (Source: eMarketer)
68. Listrak also reported that Back-in-Stock emails had an average open rate of 51.9% with an average conversion rate of 25.3% for Q2 2015. (Source: eMarketer)
69. 86% of consumers said they would like to receive promotional e-mails from companies they do business with at least monthly, and 15% like to get them daily. (Source: Statista)
70. Separate research from Experian Marketing Services is in line with the Yesmail study. According to the Q2 2015 data, 48% of all emails sent by Experian clients were opened on desktop devices and 40% of emails were opened on mobile phones and ereaders. Some 12% were opened on tablets. (Source: eMarketer)
71. Mobile click-to-open rates for US marketing emails sent by Yesmail clients in Q3 2015 were at 13.7%, up 1.6% compared to Q3 2014. Desktop click-to-open rates for marketing emails in Q3 2015 were at 18.0%, down 3.8% from the year before. (Source: eMarketer)
72. Email marketing was rated effective by more agency marketers than any other channel with 79% of agencies stating that email provides excellent or good ROI, according to an Econsultancy study in February 2015. (Source: eMarketer)
73. Among client-side marketers, organic search was rated higher, but email was still the No. 2 channel, with 66% support. (Source: eMarketer)
74. A January 2015 survey by Demand Metric and the Direct Marketing Association (DMA) found higher ratings for email’s ROI than for any other channel or format studied. (Source: eMarketer)
Social Media Statistics
Takeaway: Social media continues to grow significantly and is used by all age groups. At the same time social media business ROI measurement remains challenging, especially for smaller businesses.
Social Media Statistics 2016 SEO Digital Marketing75. In 2015, 73% of US residents had a social network profile, representing a 6% growth compared to the previous year. (Source: Statista)
76. Nearly two-thirds of American adults (65%) use social networking sites, up from 7% when Pew Research Center began systematically tracking social media usage in 2005. (Source: Pew Research)
77. 35% of all those 65 and older report using social media, compared with just 2% in 2005. (Source: Pew Research)
78. Young adults (ages 18 to 29) are the most likely to use social media with 90% using one or more platforms. (Source: Pew Research)
79. 41% of US small businesses surveyed in Spring 2015 said they didn’t use social media for business. This was up slightly from 38% in Fall 2014 and even with the 41% in Spring 2014. (Source: eMarketer)
80. December 2014 research by Zogby Analytics found that 48.2% of US small-business owners didn’t use any social media for business purposes. (Source: eMarketer)
81. In a January 2015 study by Social Media Examiner, just over 4 in 10 small and medium-sized business (SMB) marketers worldwide said they were able to measure the ROI of their social media activities. (Source: eMarketer)
82. April 2015 polling by Manta found that nearly 6 in 10 US small-business owners (SBOs) still weren’t seeing ROI from social media activities. (Source: eMarketer)
83. In the April 2015 survey by Manta of small business owners the respondents were most likely to see a return of less than $100 per month from social media marketing. Just 13.5% generated monthly social media ROI of more than $1,000. (Source: eMarketer)
84. In Spring 2015 the top social media channels used by small businesses were Facebook (41%), LinkedIn (17%), Google+ (13%) and Twitter (12%) according to Ebiquity. (Source: eMarketer)
85. Thrive Analytics found in January 2015 that many SMBs (small and medium-sized businesses) just don’t have the resources to keep up with social media. (Source: eMarketer)
86. Fully 55% of small businesses updated social media business content monthly or less frequently, while just 15% did so daily and 30% weekly. This likely means the social followers theses small businesses have—who often demand real-time, or close to real-time, info—are seeing out-of-date content. (Source: eMarketer)
87. ROI: In the Email Marketing Industry Census 2015, eConsultancy & Adestra found that among digital marketers 79% ranked ROI from email “good” or “excellent”, 76% ranked ROI from SEO “good” or “excellent”, and 35% ranked ROI from social media as “good” or “excellent.” (Source: Movable Ink)
88. Facebook and other social media sites ranked as the second most effective marketing method among US small and medium-sized businesses (SMBs) surveyed in January 2015. (Source: eMarketer)
89. Currently adoption rates for social media stand at 76% for those with college or graduate degrees, 70% of those with some college education and 54% for those who have a high school diploma or less. (Source: Pew Research)
Social media Statistics 2016 Small Business90. Facebook reports 45+ million small and medium businesses using Facebook Pages as of Q3 2015. (Source: TechCrunch)
91. Facebook had 167 million daily active users (DAUs) in the US and Canada as of Q3 2015, with 1.01 billion daily users worldwide. (Source: TechCrunch)
92. Facebook has 217 monthly active users (MAUs) in the US and Canada with 1.55 billion monthly users worldwide as of Q3 2015. (Source: TechCrunch)
93. 72% of adult Internet users are on Facebook as of August 2015. (Source: Pew Research)
94. Facebook continues to have the most engaged users. 70% log on daily, including 43% who do so several times a day as of August 2015. (Source: Pew Research)
95. Facebook reported 894 million Mobile Daily Active Users (DAUs) on average for September 2015, an increase of 27% year-over-year. (Source: Facebook Reports Q3 2015)
96. Within the overall Facebook family there are 900 million WhatsApp users, 700 million Facebook Messenger users, and over 400 million Instagram users as of Q3 2015. (Source: TechCrunch)
97. There are 925+ million people using Facebook Groups as of Q3 2015. (Source: TechCrunch)
98. Twitter has 320 million monthly active users as of September 2015. (Source: Twitter)
99. 80% of active users access Twitter via mobile devices as of September 2015. (Source: Twitter)
100. 38% of those on Twitter use the site daily as of August 2015. (Source: Pew Research)
101. There were 400 million registered users on LinkedIn as of December 2015. (Source: LinkedIn)
102. 25% of adult Internet users are on LinkedIn as of August 2015. (Source: Pew Research)
103. Pinterest has over 100 million monthly active users (MAUs) as of September 2015. (Source: VentureBeat)
104. 31% of adult Internet users are on Pinterest as of August 2015. (Source: Pew Research)
105. Mobile ads now makes up a very significant 78% of Facebook’s advertising revenue, up from 76% in Q2. (Source: TechCrunch)
106. In Q3 2015, 727 million of Facebook’s 1.55 billion Million active users were mobile-only, equivalent to 47% of users who have never interacted with Facebook on a desktop computer. (Source: eMarketer)
107. In Q3 2015, 78% of Facebook’s $4.3 billion in advertising revenue worldwide came from ads on mobile devices. (eMarketer)
108. Instagram reports 400 million users with over 75% living outside the US as of September 2015. (Source: Instagram)
109. 28% of US adult Internet users are on Instagram as of August 2015. (Source: Pew Research)
110. 55% of US Instagram users are ages 18-29 as of August 2015. (Source: Pew Research)
111. 59% of US Instagram users are on the platform daily, including 35% who visit several times a day as of August 2015. (Source: Pew Research)
112. As of September 2015, the greatest share of traffic to Instagram was from the United States with 23.9% percent of traffic, while traffic from the United Kingdom accounted for 3.57% of site visits. (Source: Statista)
113. In 2015, 40.7% of the U.S. smartphone users accessed Instagram. (Source: Statista)
Internet Statistics including Devices Usage
Takeaway: Internet usage continues to grow significantly with smartphone access and usage growing the fastest.
Internet Growth Statistics SEO Statistics 2016 Web Presence114. 35% of U.S. smartphone users check their phones more than 50 times each day. (Source: AdWeek)
115. The share of American adults who own a smartphone, computer and a tablet has doubled since 2012 from 15% to 30%. (Source: Pew Research)
116. People now spend more time using apps than watching TV. In 2015, U.S. consumers spent 198 minutes in mobile apps per day compared to 168 minutes watching TV. (Source: Mashable)
117. Half of all adult shoppers conduct product research on mobile devices while shopping in physical stores. (VentureBeat)
118. 66% of Americans own at least two digital devices – smartphone, desktop or laptop computer, or tablet – and 36% own all three. (Source: Pew Research)
119. 18% of American adults own only one of the three devices. Among single-device owners, 60% say they have a desktop or laptop computer, compared with a third (34%) whose only device is a smartphone, while 7% report their sole device as a tablet. (Source: Pew Research)
120. 16% of U.S. adults do not have a smartphone, desktop or laptop, or tablet. (Source: Pew Research)
121. There are 7.1 billion mobile subscribers globally as of November 2015. (Source: TechCrunch)
122. More than 95% of the world’s population are now within reach of a mobile network signal. (Source: TechCrunch)
123. For 2016, the number of smartphone users in the United States is estimated to reach 207.2 million, up from 190.5 million in 2015. (Source: Statista)
124. 50% of adults shop on smartphones while browsing a store. (Source: VentureBeat)
125. 38% of mobile users search at least one time per month for a local business. (Source: BrightLocal)
126. As of November 2015 Apple had a 43.1% share of Smartphone subscribers and Samsung had 28% of subscribers. LG was in third place with 9.6% of Smartphone subscribers. (Source: comScore)
127. There are now over 727 million mobile-only Facebook users. (Source: TechCrunch)
Holiday Season 2015 eCommerce Statistics
Takeaway: E-Commerce Business was good and growing during the 2015 holiday season (November 1 – December 31). The holiday season statistics below are from Custora, a predictive marketing platform, that provides a free online dashboard tracking real-time online transactions from over 200 US online retailers, 500 million online shoppers, and over $100 billion in transaction revenue.
128. The 2015 holiday shopping season (Nov. 1 – Dec. 31) was a strong one for US e-commerce retailers with revenue up 12.1% over the same period in 2014. (Source: Custora)
129. E-commerce revenue was up 16.2% on Cyber Monday 2015 compared to Cyber Monday 2014, making it the biggest day in US online shopping history. (Source: Custora)
130. For the full 2015 holiday weekend (Thanksgiving day through Cyber Monday), revenue growth over 2014 came in strong at 16.4%. (Source: Custora)
131. A total of 30.4% of online sales were placed on mobile (phones and tablets) during the 2015 holiday shopping season (Nov. 1 – Dec. 31), up from 25.9% of sales in 2014. (Source: Custora)
132. The share of transactions made on mobile phones during the 2015 holiday shopping season (Nov. 1 – Dec. 31) climbed from 14% in 2014 up to nearly 19.9%% in 2015. (Source: Custora)
133. Apple continued to rule the mobile shopping game with 76.9% of orders placed on iOS devices during the 2015 holiday shopping season. (Source: Custora)
134. Consumers using Android devices accounted for 22.7% of online transactions over the 2015 holiday shopping season, up slightly from 20.7% in 2014. (Source: Custora)
135. Search ruled holiday shopping in 2015, claiming a combined total of 39.2% of orders: organic (free) search with 21.5% and paid search with 17.7%. (Source: Custora)
136. E-mail marketing was the leading channel behind search, driving an impressive 20% of online sales during the 2015 holiday shopping season (Nov. 1 – Dec. 31). (Source: Custora)
137. Social media (Facebook, Twitter, and Pinterest, etc.) drove only 1.8% of sales during the 2015 holiday shopping season, down slightly from 1.9% of sales in 2014. (Source: Custora)
138. Cyber Monday e-commerce revenue was up 16.2% over Cyber Monday 2014, and orders (transactions) were up 14.7%. (Source: Custora)
139. Mobile Shopping (e-commerce orders made on mobile phones and tablets) accounted for 26.9% of orders on Cyber Monday 2015, a jump from only 23% on Cyber Monday 2014. (Source: Custora)
140. For the full holiday weekend, mobile shopping accounted for 32.1% of orders, up from 26.4% over the same period in 2014. (Source: Custora)
141. Black Friday was “Mobile Friday,” with mobile accounting for 36.1% of orders, up from 30.3% of orders on Black Friday 2014. (Source: Custora)
142. The vast majority of mobile shopping happened on Apple devices over the Black Friday-Cyber Monday weekend – 78.1%, while only 21.6% happened on Android devices. (Source: Custora)
143. Apple’s share is down from 79.6% on last year’s holiday weekend 2014, while Android’s share is up from 19.7%. (Source: Custora)
144. Email Marketing was the channel that drove the most online sales on Black Friday. While usually lagging behind online search (free and paid), on Black Friday 2015 email marketing was the primary channel, driving 25.1% of sales. (Source: Custora)
145. Beyond email, 21.1% of sales originated through free search, and 16.3% through paid search on Black Friday. (Source: Custora)
146. Cyber Monday exhibited a similar trend, though less pronounced – with email marketing driving 22.1% of orders, free search 20.7%, and paid search 16.6%. (Source: Custora)
147. For the holiday weekend, the story is similar, with email marketing generating 23.3% of orders, free search 20.5%, and paid search 15.9%. (Source: Custora)
148. Social media (including Facebook, Twitter, Instagram, and Pinterest) was not a meaningful channel during the holiday 2015 weekend, driving only 1.6% of e-commerce orders. The same applies to Cyber Monday, where social media networks drove 1.5% of orders. (Source: Custora)
149. The strong growth overall for the weekend was driven by mobile shopping (Apple devices in particular), email marketing, and Google search. (Source: Custora)
150. The share of orders placed on desktop computers over the 2015 holiday shopping season dropped from 74.2% in 2014 to 69% in 2015. (Source: Custora)
Conclusion:
Good information leads to better decisions. This posts contained a wide range of statistics that can serve as starting points for shaping business SEO, content marketing, email marketing, social media marketing and website development strategies in 2016. The next step is to identify which numbers are most useful to your business and dig in. Following the Source links will provide additional information and further context for the numbers.
http://www.webpresencesolutions.net/150-digital-marketing-seo-statistics-2016/
Email remains the most effective digital marketing tool for both B2B and B2C marketers. But the majority of email activity now takes place on mobile devices, and not all marketers have effectively adapted to this rapid shift.
Those are just a couple of the findings in the nearly four dozen email and mobile marketing facts and statistics from 15 different sources compiled below. Five more key takeaways from this research:
Most popular activities on smartphones
Image credit: emailmonday
Email marketing works—for both sellers and buyers. Digital marketers rank email as their most effective marketing tactic, and say it has the highest ROI of any digital channel. It’s also the most effective digital tactic in B2B marketing, with nearly a third of B2B marketers saying it has the biggest impact on revenue. And 72% of U.S. adults prefer communication with companies to happen through email.
Personalized email subject lines: effective, but underused. For B2C emails, personalized subject lines increase the open rate by 41%, and lead to higher transaction rates and revenue per email. Yet only 35% of brands personalize their subject lines.
Mobile email marketing lags consumer adoption. Email is increasingly mobile. The number of mobile email users rose 22% last year and is projected to grow another 23% in 2016. In the second quarter of 2015, roughly two-thirds of emails were opened on mobile devices, with more than half opened on smartphones. Yet 51% have either no strategy for mobile email or only the basics for mobile email optimization in place.
Mobile advertising spending up through results are uncertain. U.S. marketers increased their spending on mobile advertising by 50% in 2015 over the previous year, and the share of budget dollars allocated to mobile marketing is projected to triple in the next three years. Yet most senior marketers say today’s mobile marketing effort perform poorly; 8 in 10 have difficulty tracking mobile ROI; and half of all clicks on mobile ads are accidental.
B2B mobile marketing growing but still small. The percentage of B2B marketing dollars devoted to mobile is expected to nearly triple by 2018—but still account for only 14% of total spending. And while mobile use for B2B purchase research has jumped 91% in the past two years, more than three-quarters of global business executives still prefer to browse content on their laptops or desktops.
And now on to the 45 phenomenal email and mobile marketing stats and facts. Enjoy!
14 Email Marketing Stats and Facts
1. The number of email users worldwide is currently 2.6 billion and is expected to grow to over 2.9 billion by 2019. (MediaPost)
2. A large majority of U.S. adults — 72% — prefer communication with companies to happen through email. (MarketingSherpa)
3. Email is the only digital channel that outperforms old media standbys in terms of how consumers prefer communcations with companies — postal mail (preferred by 48%), television ads (preferred by 34%) and print media, such as magazines and newspapers, (preferred by 31%). Only 11% of people prefer mobile apps and just 7% prefer online video ads. (MarketingSherpa)
4. Email is the most effective digital marketing tactic for B2B marketers, with 31% saying it has the biggest impact on revenue. (MarketingProfs)
5. Across all age groups, email is the preferred method of commuicating with companies (with about three-quarters of consumers/buyers choosing this). However, while more than 60% of those aged 55 and older like to communicate with companies by postal mail, just 29% of millennials say the same. (MarketingSherpa)
6. Personalized email subject lines increase open rates–but the effect varies considerably across industries. Personalizing the subject line increases open rates for consumer products and services by 41%, versus 13% for B2B emails. (MarketingSherpa)
7. For consumer products and services, personalizing email subject lines also increases transaction rates by 49%, and revenue per email by 73%. (MarketingSherpa)
8. And yet–only 35% of brands personalize their email subect lines. (MarketingSherpa)
9. 46% of startups use email marketing. (TNW News)
10. Digital marketers rank email as their top marketing tactic, with 54% saying it’s their most effective channel and just 11% calling it the most difficult. Mobile marketing and SMS, however, ranked near the bottom in the same survey, with just 9% citing it as their most effective tactic while 34% viewed it as the most difficult. (TNW News)
Recommended for You
Webcast, October 3rd: How to Create Hilarious Content People Will Be Dying to Share
11. Email is viewed as the most effective digital marketing tactic for customer retention purposes. But while 56% of marketers viewed email as an effective retention tactic, just 8% said the same for mobile advertising. (TNW News)
12. Direct marketers say email has the highest ROI of any marketing tactics. Mobile falls near the bottom of the list, however, below direct mail and just ahead of paid search advertising. (TNW News)
13. Asked about all the different devices they use to open and read emails, 93% of consumers use a laptop or desktop computer; 67% use a smartphone; and 42% use tablets. (Email Monday)
14. Asked why they unsubscribe from brand emails, 33% of consumers said they do so because mailings are too frequent. 24% unsubscribe because the content is repetitive and boring. (SocialTimes)
5 Mobile Marketing Stats and Facts
15. 57% of consumers will not recommend a business with a poorly designed mobile site. (Payfirma)
16. 61% of people have a better opinion of brands when they offer a good mobile experience. (Payfirma)
17. 73% of all the people on earth (5.2 billion) are mobile phone users. 40% of those (just over two billion) own smartphones. (Mary Meeker’s Internet Trends)
18. 44% of millennials use their smartphones’ camera or video functions at least daily; an astounding 87% use those features at least once per week. 76% share photos and video on social media. (Mary Meeker’s Internet Trends)
19. Mobile accounted 45% share of US organic search traffic in the first part of 2015 (based primarily on retail / B2C client data). The iPhone (18%) and iPad (12%) alone contributed a combined 30% of organic search traffic. (e-Strategy Trends)
7 Mobile Email Stats and Facts
20. Two-thirds of all U.S. emails were opened via mobile in the first quarter of last year. Half were accessed on smartphones, and 17% occurred on a tablet, with the remaining 33% being opened on your traditional desktop. (V3 Broadsuite Blog)
21. The number of mobile e-mail users is predicted to grow 22% in 2015 and 23% in 2016. (Email Monday)
22. 17% of marketers admit they have no strategy for mobile email, while 34% have the basics for mobile email optimization in place. Just 21% say they have an advanced mobile email strategy. (Email Monday)
23. A study of B2C (primarily retail) email campaigns found that in the first quarter of 2015, mobile opens (50.12%) have surpassed desktop opens (32.97%). What’s more, 36.6% of people make purchases on a desktop, while 49.3% of people make purchases on smartphones. (MarketingSherpa)
24. In the second quarter of 2015, nearly 68% of emails were opened on a mobile device, with 52% of those being opened on smartphones. The desktop saw just over 32 percent of email opens. (MarketingLand)
25. However–almost 53% of all conversions in 2Q15 were on the PC. Smartphones drove 29% of conversions and tablets 18%. (MarketingLand)
26. The iPhone is the single dominant mobile email reading device, but its users spend the least amount of time looking at individual emails. Mobile devices drive more opens but far fewer conversions (example: iPhone: 42% of opens, 18% of conversions). (MarketingLand)
8 Mobile Advertising Stats and Facts
27. The share of budget dollars spent on mobile marketing by B2B marketers is expected to nearly triple in the next three years, from 5% today to about 14%. B2C marketers plan to increase the portion of budgets spent on mobile from 8% today to about 20%–even though most senior marketers say today’s mobile marketing efforts perform poorly. (The CMO Survey)
28. Total online ad spending in the U.S. is $50 billion, of which $13 billion is spent on mobile ads. (Mary Meeker’s Internet Trends)
29. 8% of total U.S. ad spending is on mobile, though it accounts for 24% of all media consumption. Meanwhile, 18% of all ad spending is on print–which accounts for just 4% of media use. (Mary Meeker’s Internet Trends)
30. The media and entertainment industries have been aggressive with mobile marketing. Advertising on mobile devices accounted for nearly 54% percent of digital ad spending in the entertainment industry in 2015. Media brands devoted 51% of their digital advertising spending to mobile, with 51 percent. (V3 Broadsuite Blog)
31. And yet–when conducting research to help make significant business decisions, 78% of global business executives prefer to browse content on their laptop or desktop computers (vs. 7% for smartphones). (MarketingSherpa)
32. U.S. marketers increased their spending on mobile advertising by 50% over 2014 to $28.72 billion in 2015. (MediaPost)
33. Despite its projected growth, however, much of the impact of mobile marketing is still difficult to measure. Nearly eight in 10 U.S. marketers said they would increase spending on mobile if they could track return on investment (ROI) better. (MediaPost)
34. About 50% of clicks on mobile ads are accidental. (GoldSpot Media)
4 Mobile Shopping Stats and Facts
35. One in four mobile online shoppers in the US is over the age of 55. (Payfirma)
36. Mobile is projects to account for 25% of all U.S. online sales by 2017, and mobile devices will account for 30% of global retail e-commerce spending by 2018. (Payfirma)
37. 90% of those aged 18-35 have used their mobile device in store. (Payfirma)
38. Email marketing typically represents about 20% of retail traffic, and often a higher share of orders (25-30% for some retailers). While phones represent about 18% of orders, over 50% of emails are opened on phones. (MarketingSherpa)
4 Mobile Social Media Stats and Facts
39. Facebook and Twitter reported that mobile revenue in 2Q15 made up 76% and 88% of their total revenue, respectively. (MediaPost)
40. Marketers who use email in combination with social sharing can drive six times more revenue. Social sharing buttons have been shown to push click-through rates 158% higher. (MediaPost)
41. 189 million Facebook users are “mobile only.” (Cloudswave)
42. 27% of brand mentions on Twitter come from an iPhone and 18% come from an Android device. 21% come from a web browser. (Infini Datum)
3 B2B Mobile Marketing Statistics
43. 42% of B2B buying researchers use a mobile device during the B2B purchasing process. Mobile use for B2B purchase research has grown 91% in the past two years. (MediaPost)
44. 49% of B2B researchers who use their mobile devices for product research do so while at work. They’re comparing prices, reading about products, comparing feature sets and contacting retailers. They’re purchasing, too; purchase rates on mobile are up 22% in the past two years. (MediaPost)
45. 89% of B2B technology marketers say they use email to market their products. However, just 15% run mobile campaigns. (MarketingProfs)
http://www.business2community.com/marketing/45-phenomenal-email-mobile-marketing-stats-01451352#UQFd77wFjErxZ3dV.97